Warning - This article describes equipment and circuits that operate at high voltages. Don't attempt to repair any high voltage circuits if you're not trained to safely work with electricity. You may be seriously injured or even killed. For further information read the blogs Terms Of Use.
ALDI recently had a "sale" on LED lighting tubes that fit into standard fluorescent lighting sockets. I'd been wanting to try LED fluoro replacements for a while but was unsure of the quality of different products, so I decided to just dive in and find out the pros and cons first hand by buying 4, 1700 lumen, 18 Watt, 1200 mm modules. To make things a little more interesting I took some power measurements before and after performing a few modifications to the existing fluorescent batten to save more power.
 |
| LED Light Tube & Replacement Starter |
They come with the standard
European Union Energy Label on the box to indicate the energy efficiency of the module. The exact definition of the A+ rating is a little hard to find, but seems to mean that for a non directional light, it has an Energy Efficiency Index (EEI) of between 0.11 and 0.17. The EEI has a bit of a convoluted definition but at its core it's a measure of how much power is used to generate an amount of light, with smaller numbers being better.
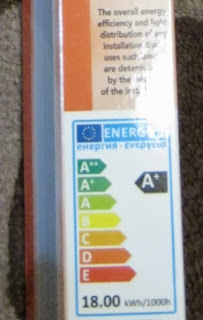 |
| European Union Energy Label |
For those interested the electrical specs are on the side as well. The lights have a neutral white colour temperature of 4000K, and a colour rendering index of above 80. They're supposed to survive 15,000 on off cycles and have a life of 30,000 hours. Those figures are a little suspicious. I have a feeling that although the individual LEDs may last that long, the electronics driving them will fail long before that.
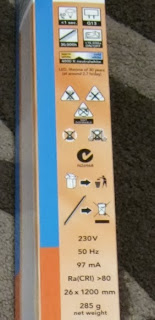 |
| LED Light Specifications |
The installation process was simple. The old starter and tube needs to be removed and replaced with the new ones.
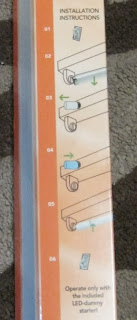 |
| LED Installation Instructions |
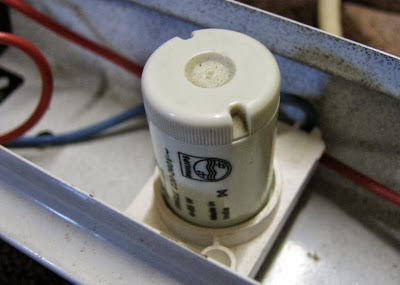
The replacement starter is really simple, it's just a short circuit.
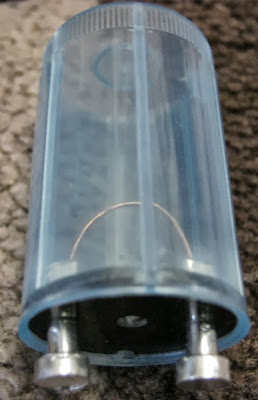 |
| Shorted Starter |
To understand the purpose of the shorted starter it may help to gain an understanding of how a fluorescent tube normally operates. This
post from a while back should be a good starting point. Using the diagram from that blog the short makes sense.
In the normal operation of a fluorescent tube, a series path between active and neutral is created at start up via the two end filaments (F), the starter (C), and the ballast (G). A LED tube replacement simply has one end shorted instead of a filament (let's say the right one for arguments sake) and draws all its power from the other end (where the left filament would normally be). For this to occur, the starter needs to be replaced with a shorted link. The power will then flow from the input, through the ballast, through the shorted filament on the right, through the shorted starter and into the power supply for the LEDs on the left.
 |
| Fluorescent Tube Operation Schematic |
The below EEVblog video featuring Doug Ford has a really good explanation of the different ways LED replacements can be wired. Skip to 12:30 for the explanation, but the whole video is worth a watch.
In the video it was mentioned that you may be able to save some power by removing the ballast and capacitor, and I wanted to test this out. Using a fluoro batten and some basic measurement equipment I set up a small test jig.
 |
| Fluoro Batten |
The batten is connected to an earthed power lead and allows easy access to internal components for testing.
 |
| Fluoro Batten Components |
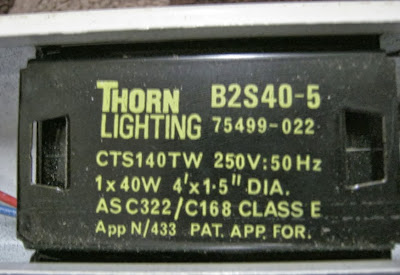
The ballast or inductor is used in a fluorescent light for two purposes, it helps generate a striking voltage to start the lamp, and when in operation it regulates the current flow through the tube. The LED module works with it in place but doesn't need it to work. This particular one is an old magnetic core variety.
 |
| Ballast / Inductor |
The starter will be replaced with the shorted version.
 |
| Starter |
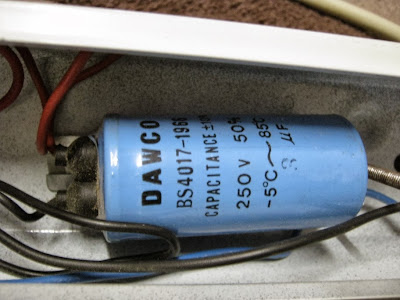
Although the inductor regulates the current through the tube it introduces a lagging current. This causes a higher current flow than necessary in the supply network and is counteracted by placing a capacitor across the supply to the batten. As the ballast will be removed and the load is close to linear, this capacitor can be removed.
 |
| Power Factor Correction Capacitor |
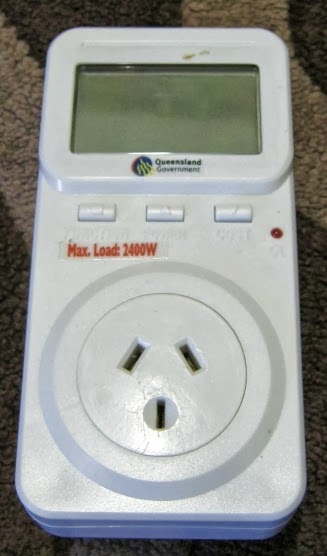
To measure the current, voltage, and power of the load, I'm using one of the power meters that the state government were selling. They aren't super accurate, but it will allow me to get a ballpark estimate of the parameters I'm trying to find. Another advantage is that I don't have to mess around with 230 Volts. I set up my experiment, take a step back, plug it in, record the data and then unplug everything. No points for being a hero around mains power.
 |
| Power Meter |
Test 1 - No Light Installed, Ballast and Capacitor Installed
Measured
Power 0.3 Watt
Voltage 245 Volt
Current 0.263 Amp
Derived
Phase Angle 89.7°
Real Load = 4 Ω
Reactive Load Magnitude = 931 Ω
In this test the only thing connected across the supply voltage is the Power Factor Reduction Capacitor. This accounts for the reactive load. The reactive load can be used to calculate the size of the capacitor. Using the equation X = 1/jωC the capacitance is be calculated to be 3.4 uF. This agrees with the 3 uF value printed on the side.
Test 2 - Fluorescent Tube, Ballast and Capacitor Installed
Measured
Power 40.9 Watt
Voltage 245 Volt
Current 0.2 Amp
Derived
Phase Angle 33.4°
Real Load = 1022 Ω
Reactive Load Magnitude = 674 Ω
When in operation the load is still reactive but it's not too bad. Due to the limited measurements taken, it's unknown if the load is inductive or capacitive.
Test 3 - LED Light, Ballast and Capacitor Installed
Measured
Power 19 Watt
Voltage 245 Volt
Current 0.283 Amp
Derived
Phase Angle 74.1°
Real Load = 237 Ω
Reactive Load Magnitude = 832 Ω
After the LED tube was installed, real power use dropped to 19 Watts. The phase angle is still high and the current is quite large. Now let's see what removing the capacitor and ballast does.
Test 4 - LED Light and Capacitor Installed, Ballast Removed.
Measured
Power 18.3 Watt
Voltage 245 Volt
Current 0.296 Amp
Derived
Phase Angle 75.3°
Real Load = 208 Ω
Reactive Load Magnitude = 801 Ω
The phase angle and current are both still high. The real power did go down if you believe the power meter, but only by a small amount.
Test 5 - LED Light Installed, Ballast and Capacitor Removed.
Measured
Power 17.9 Watt
Voltage 245 Volt
Current 0.087 Amp
Derived
Phase Angle 32.88°
Real Load = 2364 Ω
Reactive Load Magnitude = 1528 Ω
The
phase angle and current have dropped significantly. The readings don't make a lot of sense compared to the test 5, but you have to remember that the load numbers given are for series loads. If you work out the equivalent parallel load things are a bit clearer.
The Conclusion
I've been living with the lights for about a week now and I'm quite impressed. The amount of light they give out is equivalent. I don't have any test gear to measure this, but they seem very similar to the fluorescent tubes they replaced. The eye has a remarkable ability to compensate for different lighting conditions so it's hard to tell, but I think they're close. When choosing lighting the main number you use to compare lamps is
luminous efficacy. These come in at 94 lumens per Watt, a high number, and although there are fluorescent tubes out there with better ratings they aren't directional. If you have a fluorescent tube in a trough with a good reflector to redirect the light that goes towards the ceiling, they might be a better option. In my case however any light that a tube emits upwards is pretty much lost, this makes the directionality of the LED replacement tubes more attractive.
As for removing the ballast and capacitor from the batten to save power, that's up to you. You might save a couple of Watts, and when your only using 18 Watts that's significant, but it does require you to know exactly what you're doing. You don't want to mess around with mains power. Personally, I left them in. If I ever need to use a fluoro tube in the fitting the change over is simple. I'm happy enough cutting around 17 Watts from the lighting load. Another positive is that they don't seem to attract moths. Which is bad news for the gecko that used to hang around my window eating moths, he was entertaining to watch.
For a bit more information I reccomend the following two EEVblog videos about these exact tubes.

